
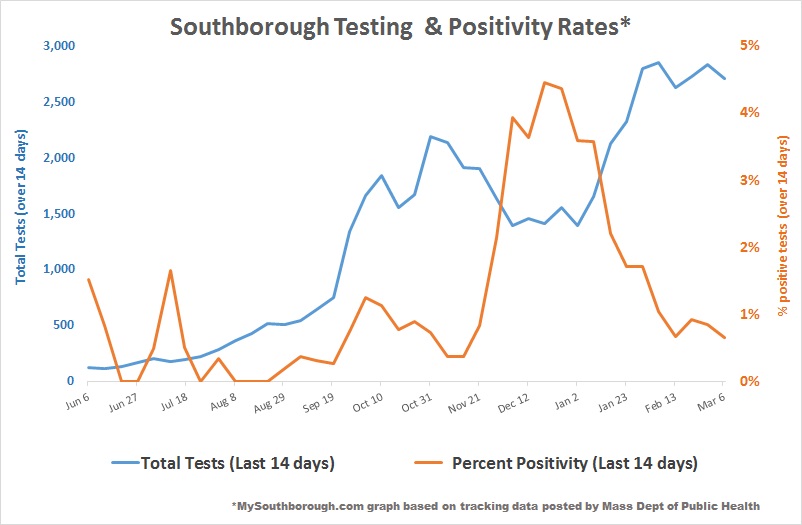
Above: Southborough’s positivity rate is continuing to go down. (click graph to enlarge)
Last night’s report from the Mass Dept of Public Health moved Southborough into green/low risk for the first time since before Thanksgiving. The shift followed 3 weeks in yellow, preceded by 11 weeks of being designated red/high risk.
The report is of data covering results from tests taken during the 14 day period ending Saturday, March 6th. The change is based on 14 positive results that came in by Wednesday. That’s down from 20 in the prior week’s report.
The % of tests confirmed positive was also lower this week (0.66%) You can see details of the positivity rate trend in my graph above. The Town’s Average Daily Incidence Rate per 100,000 was also lower (10.3).
The good news comes on a day that marks a significant anniversary in the lives of many families in our town.
On Thursday, March 12th, the public schools of Northborough and Southborough announced that school would be closed on Friday. What was intended to be a one day closure turned into a much longer one, eventually shifting to remote schooling for the remainder of the school year.
While students were offered the opportunity to return to school in a hybrid model in the fall, a full return to in-person learning has yet to resume. (As I reported yesterday, on Wednesday night, the administration announced that is coming for K-5 on March 22nd and Grades 6-12 on April 26th.) Even when it does, some families will continue to keep students home in the remote only program due to safety concerns.
Surrounding towns
While our risk is shown as reduced, the state designated all of our immediate neighbors as still yellow/moderate risk. Those towns are Framingham, Ashland, Northborough, Hopkinton, Marlborough and Westborough.
I circled further out by one town to look at their stats. At this time, none of our secondary neighbors are designated red.
There are only 14 communities currently designated red/high risk. The Patch created map below, highlighting the risk designation for each town and with linked data on the stats for each town:
Note: I may update this post later today, if the Town updates its figures to show cases through Thursday.
Updated (3/19/21 9:29 am): Originally, when explaining why we shifted to green, I mistakenly referred to the original methodology.
Despite the fact that in the state’s report indicates the color for each town in the field for “Average Daily Incidence Rate per 100,000”, the metrics for our Town are based solely on the number of confirmed cases. (As I previously reported, that change was made in November.)