
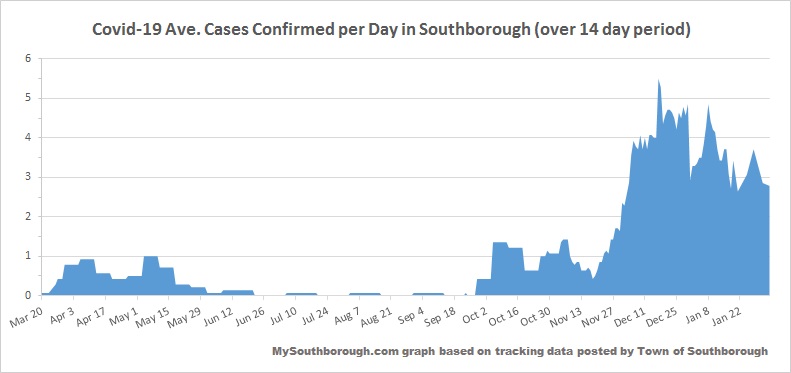
Above: The Town’s Covid-19 figures were updated as of last night. They show a continued decline in the number of cases confirmed in a 2 week period. (Click to enlarge)
With updated Covid data from the state and the Town, it’s time for a quick update.
The Town’s Covid-19 figures were updated again with figures as of 10:00 pm last night. As of the update, 39 cases were confirmed in the prior 14 days, 13 of those in the prior 7 days. The 2 week totals are still much higher than the fall, but have been trending down the past few weeks.
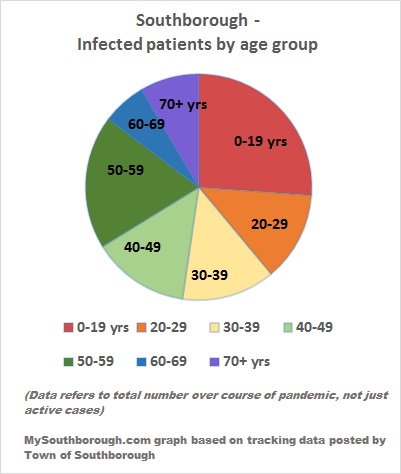
The Town’s cumulative total over the course of the pandemic was increased to 367 cases with 64 cases currently labeled active. (For details, click on graphs above and below)
![]()

This week’s report by Mass Department of Public Health (issued February 4th) keeps Southborough in the red along with Marlborough and Framingham. Ashland, Northborough, Hopkinton, and Westborough remain yellow.
The report was based on tests taken during the 14 day period ending on January 30th. It shows the Town’s Average Daily Incidence Rate per 100,000 as 32.5 (higher than the prior report) and the % of tests confirmed positive as 1.72% (no change).