
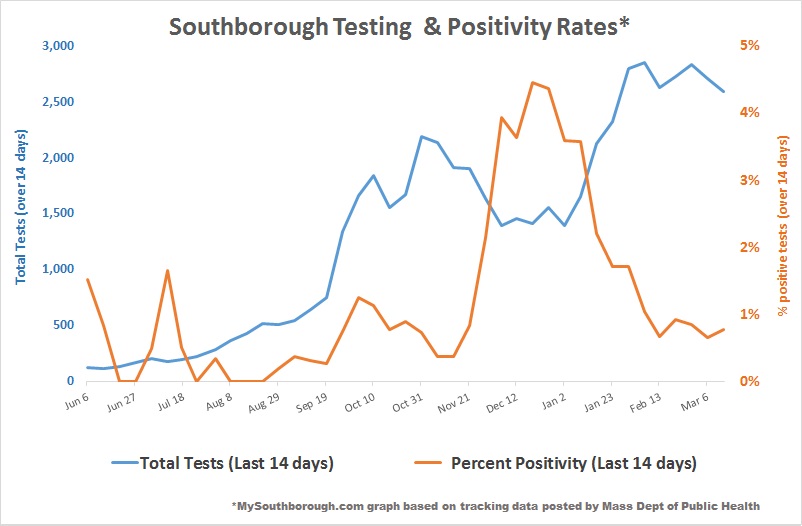
Above: Southborough’s positivity rate ticked up last week. (click graph to enlarge)
Last night’s report from the Mass Dept of Public Health moved Southborough back to yellow/moderate risk after only one week in green.*
The report is of data covering results from tests taken during the 14 day period ending Saturday, March 13th. The status is based on 19 positive results that came in by Wednesday. That’s up from 14 in the prior week’s report.
The % of tests confirmed positive for that period was higher this week (0.77%) You can see details of the positivity rate trend in my graph above. The Town’s Average Daily Incidence Rate per 100,000 was 14 (also higher).
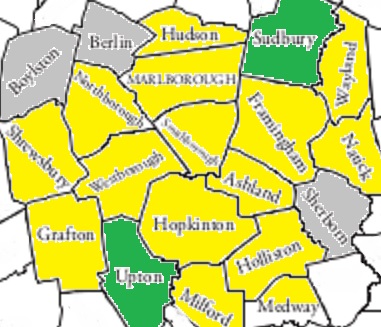 The state also designated all of our immediate neighbors as still yellow/moderate risk. (Those towns are Framingham, Ashland, Northborough, Hopkinton, Marlborough and Westborough.) I circled further out by one town to look at their stats. At this time, all of our secondary neighbors are also designated yellow except for five lower risk communities (Berlin, Boylston, Sherborn, Sudbury, and Upton).
Town Stats
This week, as often is the case, the state data is different than the my tracking of the Town’s data based on the timing and level of detail Southborough Public Health reports.**
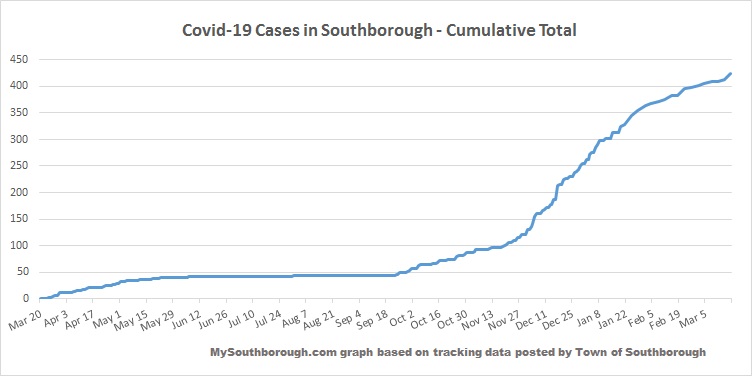
Today, the Town updated its Covice-19 figures “as of” 9:30 pm on Thursday, March 18th, with 6 new cases since Monday morning. The Town’s cumulative total over the course of the pandemic was increased to 425 cases with active cases still listed as 41.
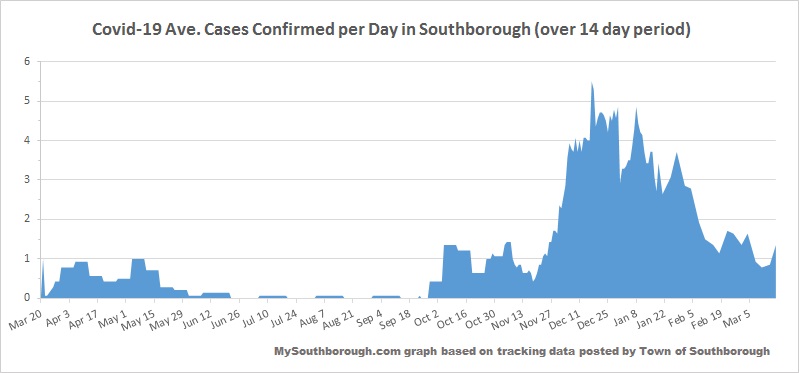
The data indicates 19 cases were confirmed in the 14 days prior, with 16 of those in the prior 7 days. (For details, click on graphs below.)
![]()
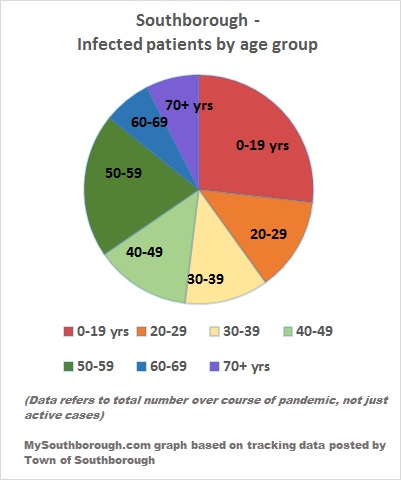
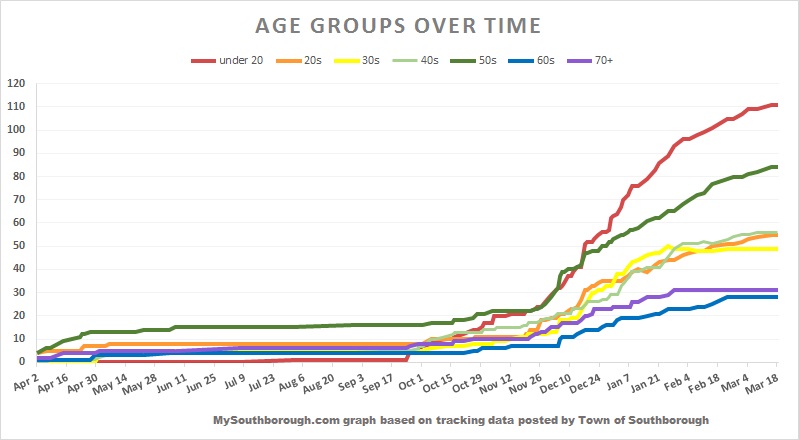
The update didn’t include updated figures by age groups. Those states were last updated “as of” 11:30 am on March 15th. (See graphs below.)
*Prior to moving into green/low risk the Town was designated yellow for 3 weeks, preceded by 11 weeks of being designated red/high risk.
** The information I track for the Town is based on when the cases are publicly reported as confirmed positive. (I don’t have detail of when patients took the tests, which is what the state judges by.) Recently, the Town has moved to sharing their numbers less frequently. (Last month they shifted to Mondays and Thursdays, but only posted on Mondays for the past two weeks.)
Updated (3/19/21 9:47 am): I added a map showing Southborough and neighbors’ risk designations in this week’s state report.
Updated (3/19/21 10:19 am): I fixed the map and details on Berlin and Boylston which were also designated grey/lowest risk.
Updated (3/19/21 3:44 pm): I updated the Town’s data based on the stats shared for cases through last night and replaced three of the graphs.