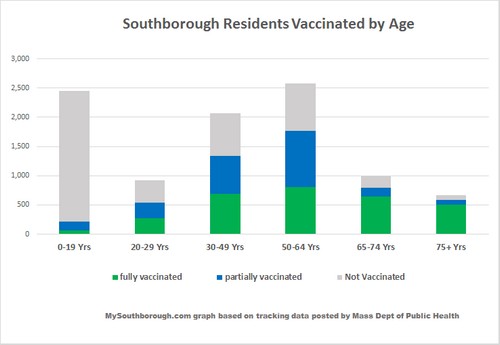
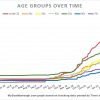
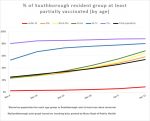
Above: More than half of Southborough residents are at least partially vaccinated. As age groups go up, so do the percent of those fully vaccinated with one exception. (Click to enlarge)
The state issued its weekly reports on Covid-19 cases and vaccinations by town. There’s some good news on both fronts.
Confirmed Cases
 The risk category for Southborough was lowered back down to yellow from red. That’s based on 24 confirmed cases in two weeks. (That’s the same as the report issued three weeks ago. In between, the difference of 2 and 3 more cases tipped us into red.)
While the Average Daily Incidence Rate was slightly lower this week (17.7% per 100,000), the percent of tests confirmed positive was listed as No Change (<0.10% difference from prior report).
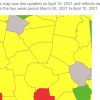 Our only direct neighbor that was red, Framingham, also downshifted to yellow. All of our other immediate neighbors remain in yellow (Ashland, Northborough, Hopkinton, Marlborough and Westborough). Circling one more level out, all of our secondary neighbors are also designated yellow except for Milford which is red and two lower risk communities (Berlin and Sherborn).
Vaccinated Residents
As of this week’s report, 54% of Southborough residents are at least partially vaccinated (as of April 13th).
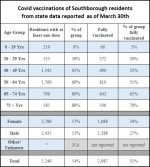
846 residents were vaccinated in one week. In those 7 days alone, 13% of residents ages 50-64 received their first (or only) dose. 84% of the population 65+ is now at least partially vaccinated.
For the most part, the percent of fully vaccinated goes up as the age group rises. The one exception is that more residents ages 30-49 are fully vaccinated is higher than those aged 50-64. It looks like that dates back to doses administered earlier in the vaccine rollout. Presumably, there were more 30-49 year olds that qualified for Phase 1 vaccinations based on their jobs.
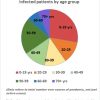
You can find more highlights by age group and gender in my graphics below (and up top)*:
(For more details on those groups, plus race/ethnicity, click here.)
Town Update
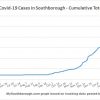
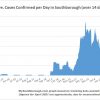
The Town issued updated figures this morning. 24 cases confirmed reported in the past 15 days, 11 in the past week. The Town’s cumulative total over the course of the pandemic was increased to 477 cases with 42 cases labeled active.
Below are my updated graphs tracking Covid cases in Southborough:
*My graph tracking vaccination progress starts March 9th, because that is the earliest vaccination report based on municipality publicly posted.
Updated (4/17/21 9:05 am): The Town issued new data this morning, so I inserted those details. Plus, I added the graph based on the state’s positivity rates for Southborough testing that I forgot to include earlier.

