
![]()
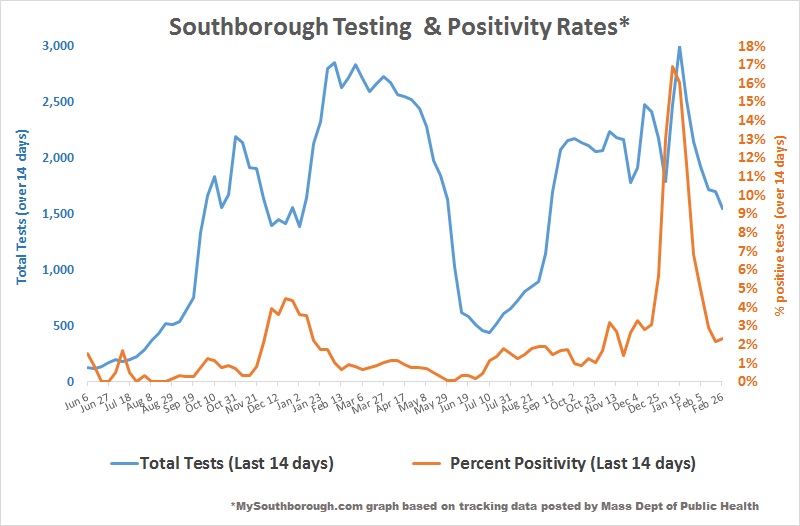
Above: There was an uptick in this week’s case report, but numbers are still lower than January. (click image above to enlarge)
Yesterday afternoon, the Town updated its Covid stats. So, it’s time for an update.
Cases and Testing
There were 22 cases new/probable cases reported in Southborough in one week. That’s up from 9 cases the prior week, but consistent with the two weeks prior and still lower than January counts. The number of active cases was 10, the same as last week.
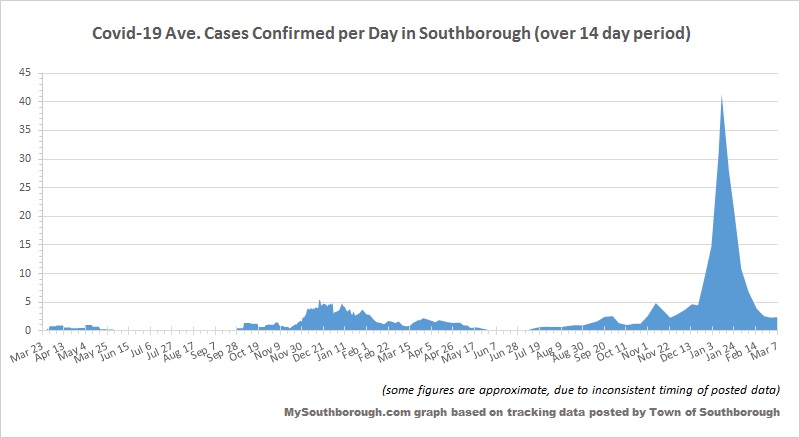 Analyzing the Town’s data, the Average Daily Case rate over 2 weeks remains lower than the period from Thanksgiving through January.
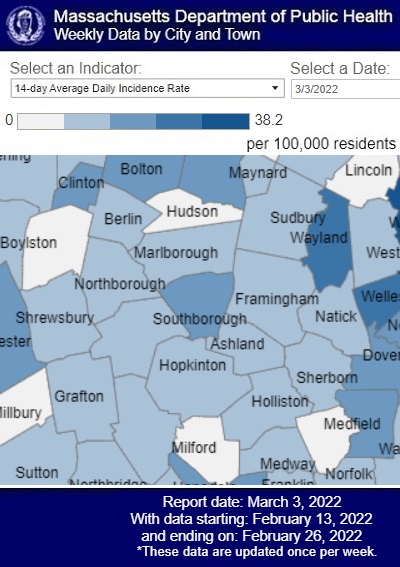
That’s in keeping with the state’s most recent report based on results from tests taken through February 26th. The March 3rd report did show a slight incline in the test positivity rate from the prior week. Yet, the 2.33% positivity was still the second lowest rate since Thanksgiving.
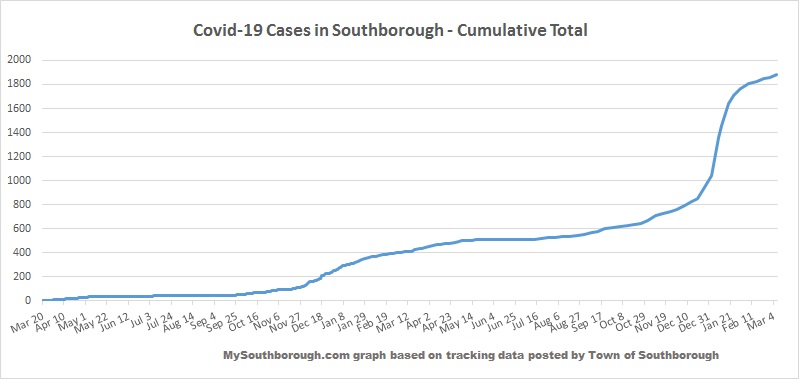
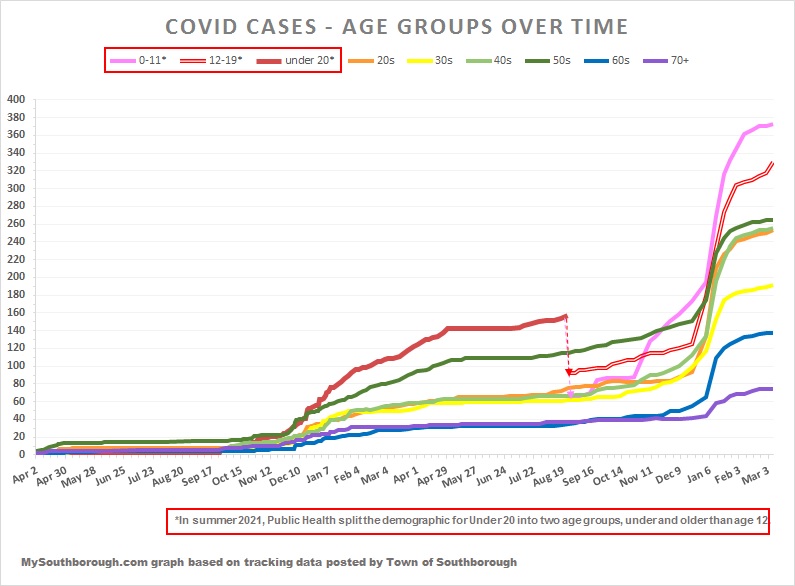
Below are more of my latest graphs based on the Town and state data, plus the map of the regional situation.
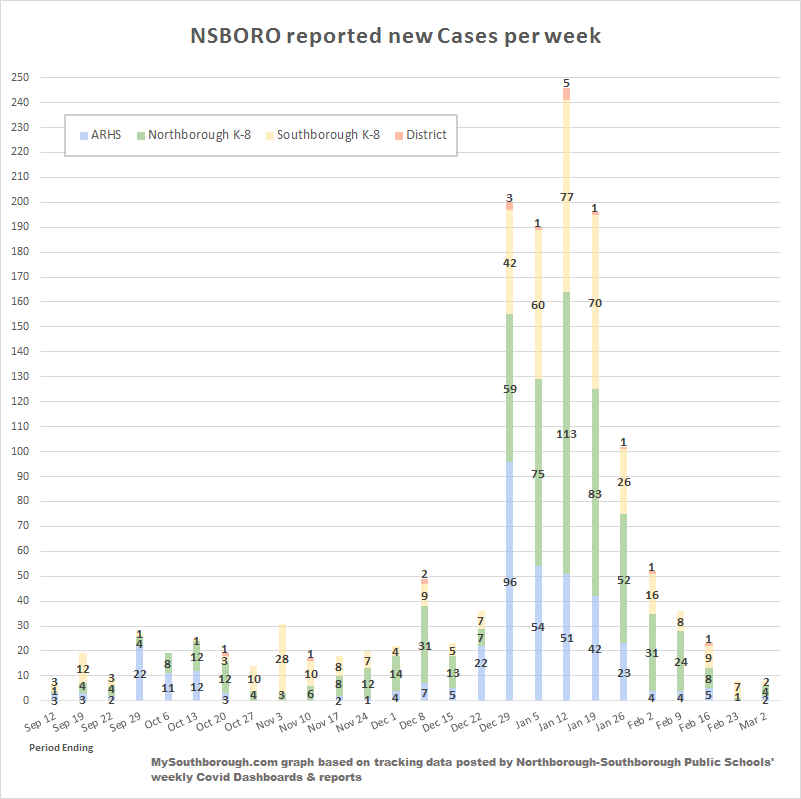
The NSBORO Schools’ latest Dashboard shows there were only 8 cases for the period ending Wednesday, March 2nd. 2 were from Southborough K-8 and 2 from ARHS. In the Daily Counts since, only three more cases were reported (all from Southborough elementary schools).
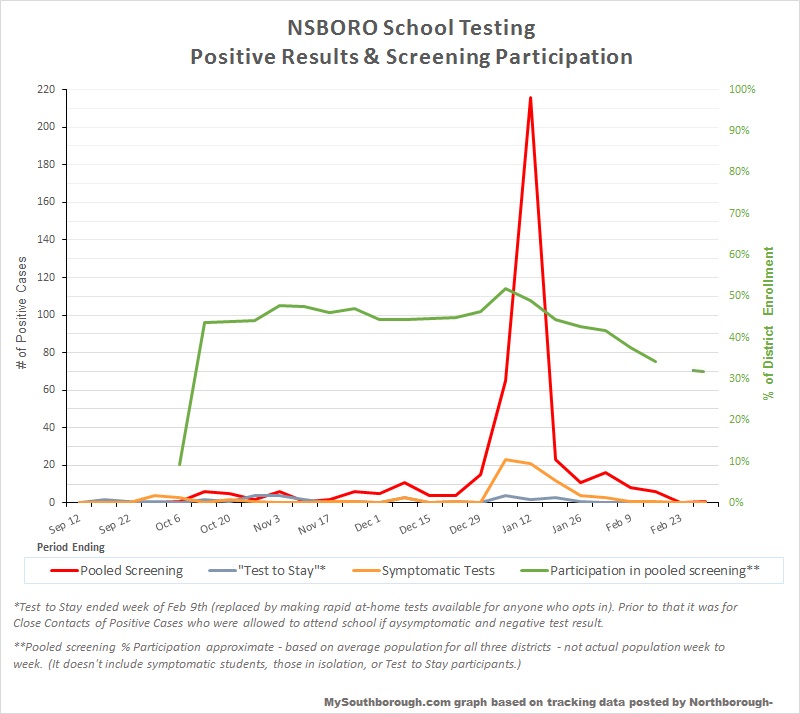
Only 1 case was identified through last week’s pooled screening program and none through testing symptomatic students/staff. (See my updated graphs below based on the Dashboard data.)
Vaccinations
As of the March 3rd report – about 95% of eligible Southborough residents were fully vaccinated and about 65% of ages 12+ had boosters (as of March 1st).*
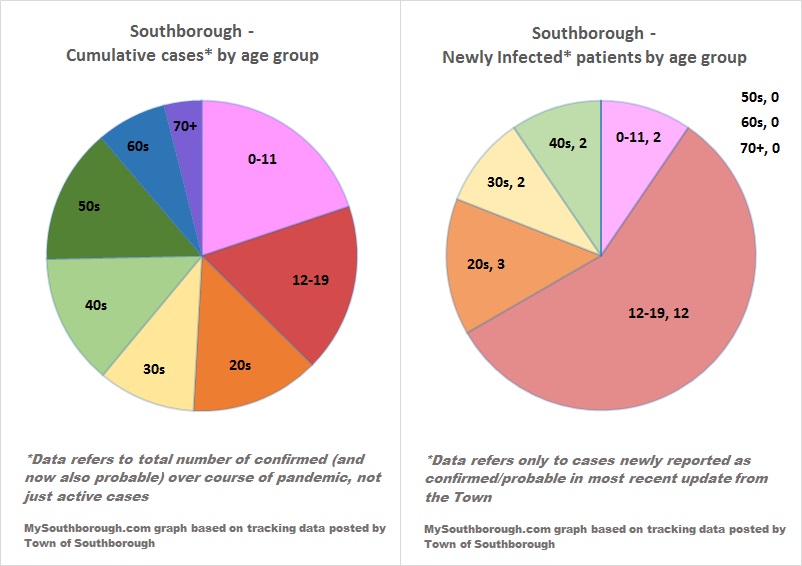
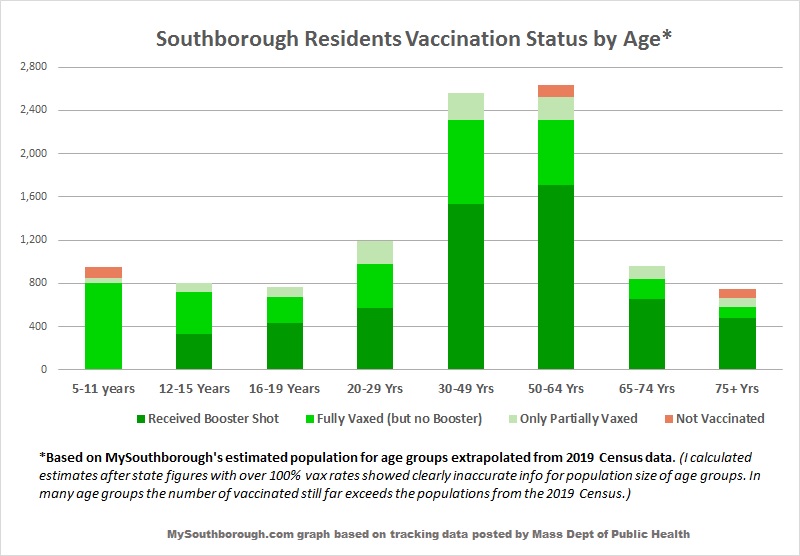
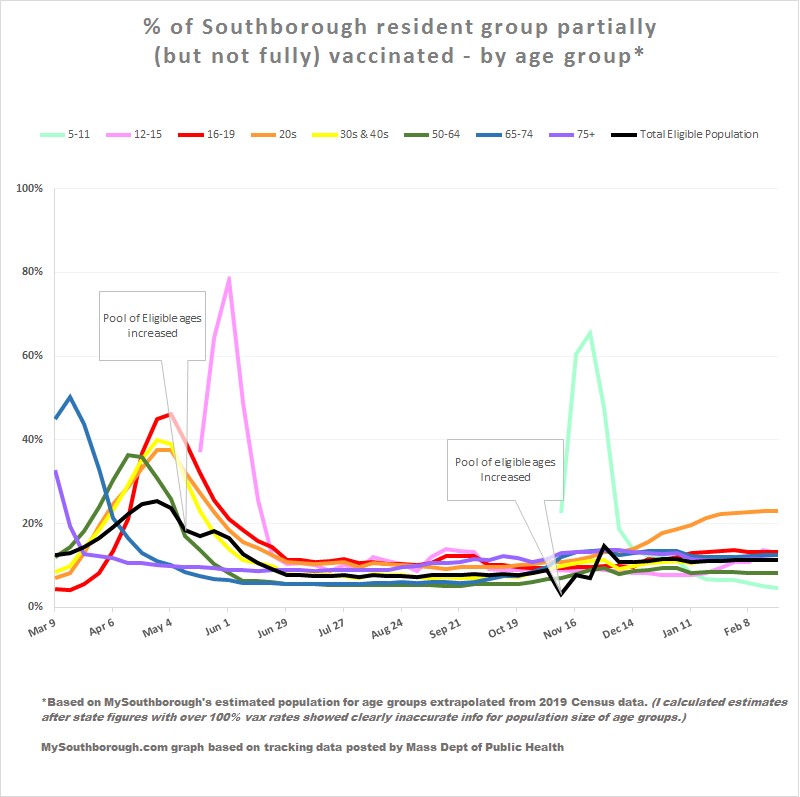
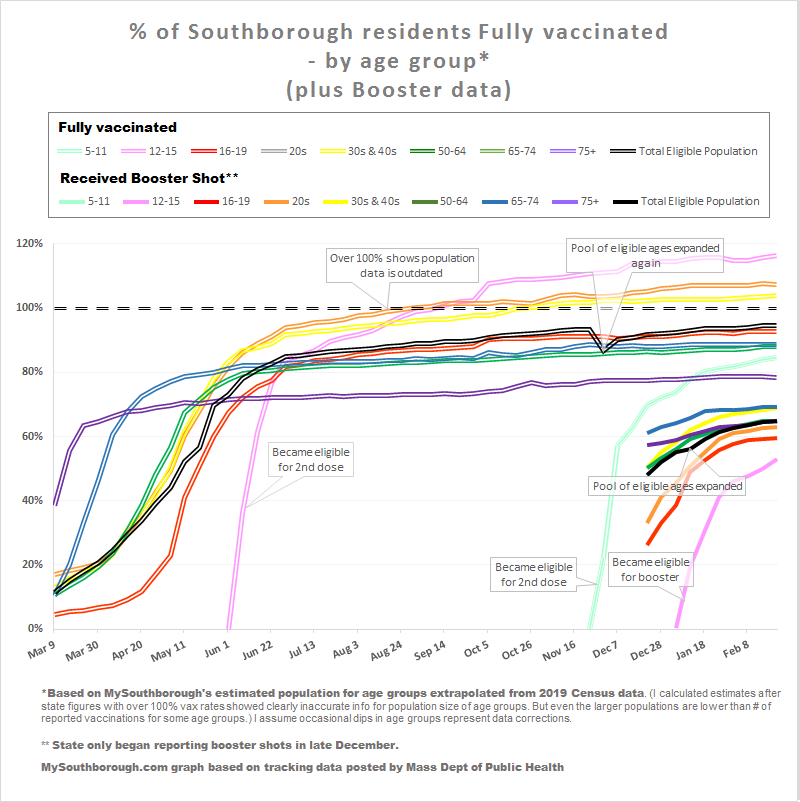
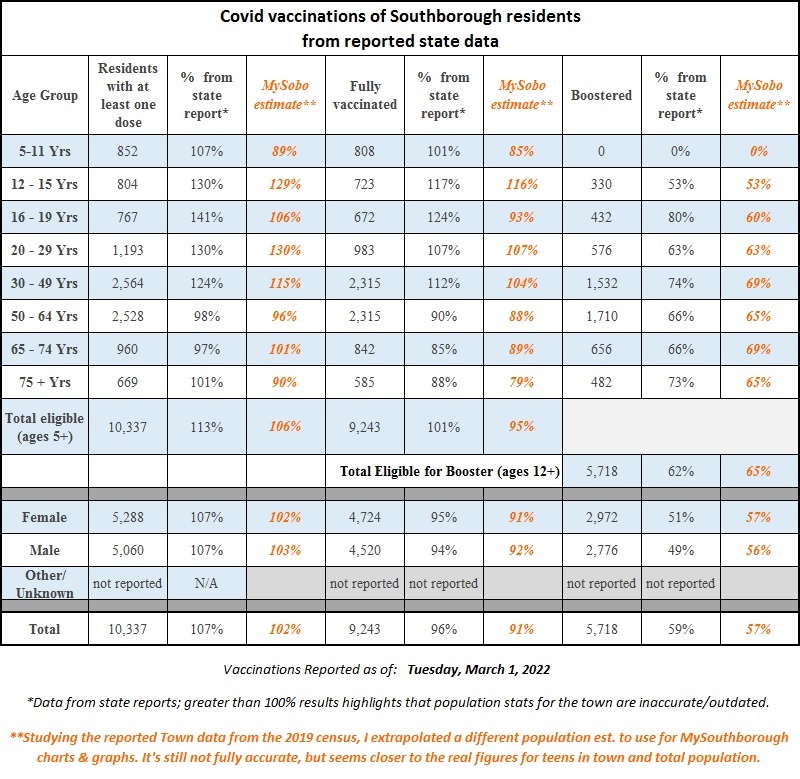 More highlights by age group and gender are in charts the chart above right and graphs below:
(For more details on those groups, plus race/ethnicity, click here.)
To find clinics/locations to receive a Covid Vaccine (including boosters) click here. For info on testing, see the Town’s Covid page here.
*I use census data since the state’s population data was clearly outdated. Yet even that clearly undercounts our population. (2020 Census Data breaking down Town demographics have yet to be released.)