
![]()
Above: The Town’s Covid-19 figures were updated as of yesterday afternoon. (Click to enlarge)
It’s time for another update on the Town and school’s Covid-19 situation.
Updated Southborough figures
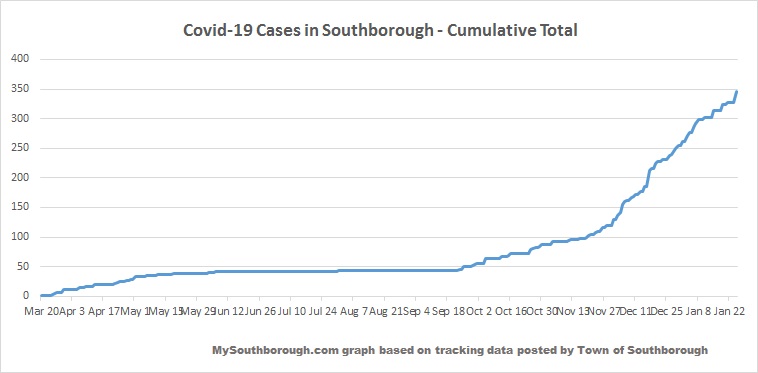
Last night, the Town posted updated Covid-19 figures (as of 7:30 pm on January 25th). As of the update, 43 cases were confirmed in the prior 14 days, 31 of those in the prior week.
The Town’s cumulative total over the course of the pandemic was increased to 345 cases with 91 cases currently labeled active. (For details, click on graphs above and below.)

Risk classifications by Town
Last week’s report (issued January 21st) keeps Southborough in the red. It shows the Town’s Average Daily Incidence Rate per 100,000 as 32.5 (lower than the prior report) and the % of tests confirmed positive as 2.21% (lower).
The state shifted Northborough and Hopkinton back into yellow with Westborough. Ashland, Marlborough, and Framingham remain in red along with Southborough.
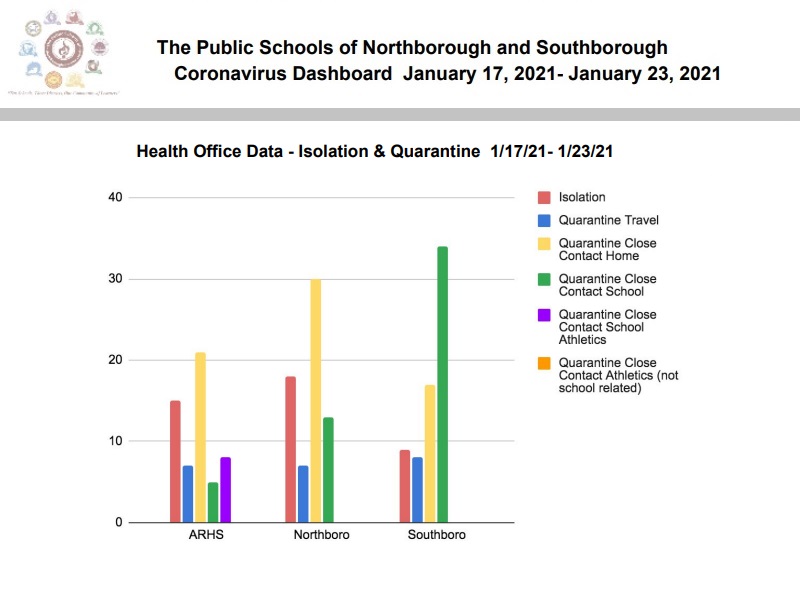
NSBORO School District Data & News
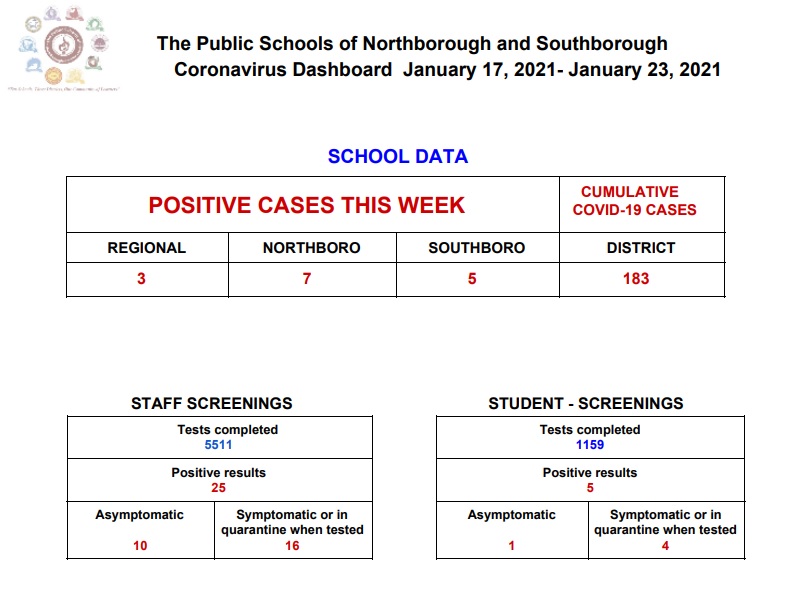
The district’s Covid Dashboard was updated on Sunday. It shows a decline in new cases and quarantines since the prior week. 15 new cases were confirmed in the district last week, 183 over the course of the pandemic.
The number of students/staff kept home for isolation/quarantine was 192 last week.
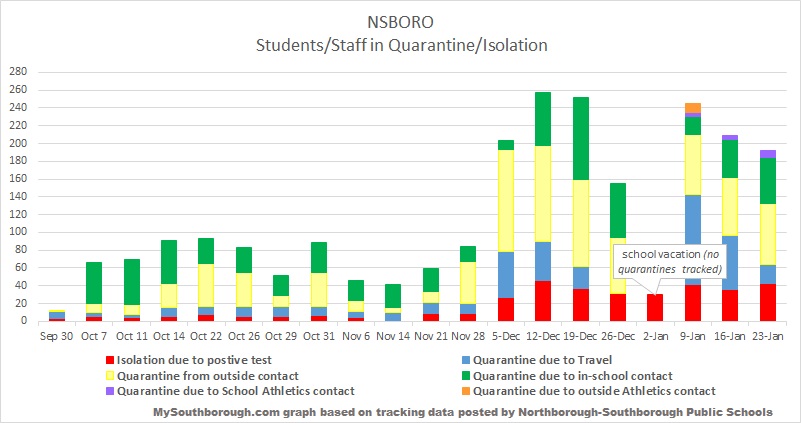
The schools’ data is below, along with my charts capturing data since the start of school from past announcements.

*The state reports are issued on Thursday evenings, based on data covering the results from tests taken in the 14 day period ending on the prior Saturday. In this case, that was a January 21st report for tests taken through January 16th.
Updated (1/26/21 8:59 am): I added in the information for the state’s risk classifications for Southborough and neighboring Towns.
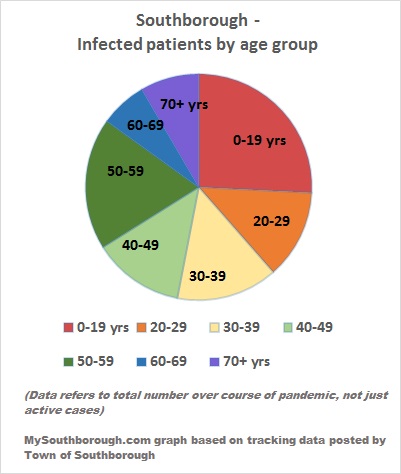
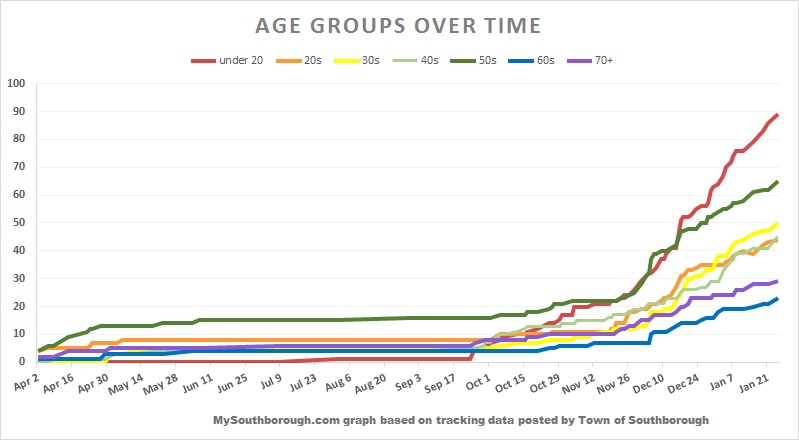
Updated (1/26/21 3:40 pm): The graph for Ages over Time in Southborough didn’t include the 17 new cases since last Thursday. I replaced it with the correctly updated version.