
Most of you probably know that the schools take up a good chunk of the town budget. But what about other services like public safety or public works or human services? Town Finance Director Brian Ballantine put together a handy chart to help Selectmen — and taxpayers — understand where the money goes.
Note that this only considers operational budgets, not capital requests that are approved separately by Town Meeting.
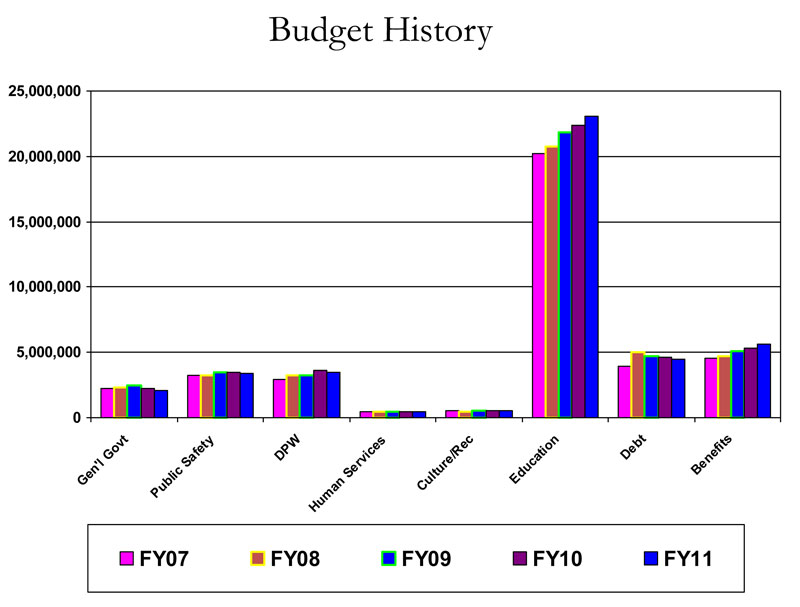
Ballantine told selectmen at a meeting in February that in the current fiscal year the schools take up 68.3% of the overall budget. That includes K-8, Algonquin, and Assabet.
“Sixty-eight percent is an awfully large portion of budget to be allocated to the schools,” Selectman John Rooney said after hearing the numbers from Ballantine.
In addition to showing how much money goes where, the chart also shows a five year trend. Ballantine said that while there have been fluctuations, municipal budgets have on the whole decreased over the past five years, while benefits and school expenses have increased.
Selectman Bill Boland acknowledged there is a divide between the municipal side and the school side when it comes to budgets, saying “I hate to pit one against the other, but reality is reality.”

Better wise up unions. Look at the charts. Every other department has decresed yet Benefits and Schools (benefits) have increased 15-20%. Slice and dice folks. Benefits and pay far out weigh what this left liberal groups in the schools and unions provide.
Mike, to be clear, the Benefits category in this chart includes both school and town benefits.
All the unions have made concessions in stipends, raises, education, and health benefits…..except one. Time for that one group to do their part or face layoffs. It’s that simple.
I wonder how much of the debt is for all the new schools we built?
My information is a bit dated but I believe that the K-8 debt service is on the order of 3.5 Million in FY 12 and in addition there is about $2.1 million to service the Algonquin Debt (it might be more based on the re-figuring of the debt allocation) I suspect that the Algonquin Debt in the chart not shown in the Debt Service Line it is the Schools line item as it is part of our assessment from Algonquin. To be fair it really should be shown in the debt line.
The short answer is the vast majority of our debt service and debt is school related. However, an 8-10 million police facility, from a debt perspective, may well be the most costly building we have built because the state will not reimburse us for any portion of the debt.
If you think about how many people are directly served and for how much time, it’s really not a surprise that we spend two thirds of our budget on schools. It’s also not a surprise that we have to look closely at it in hard times.
i must remember to take off my left liberal flag before stepping out today….