
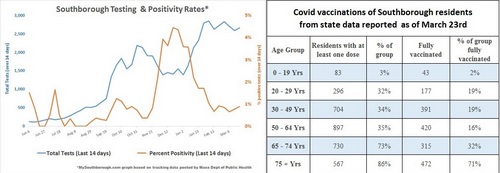
Above: Southborough’s positivity rate ticked up again. But there is good news on the vaccination front.
While the recent Covid-19 figures are up, last night’s report from the Mass Dept of Public Health kept Southborough in yellow for the second week. The state also reported details on vaccination rates for residents.
Covid Testing Results
Last night, the state reported of data covering results from tests taken during the 14 day period ending Saturday, March 21st. The yellow/moderate risk status is based on 24 positive results that came in by Wednesday. That’s up from 19 in the prior week’s report.
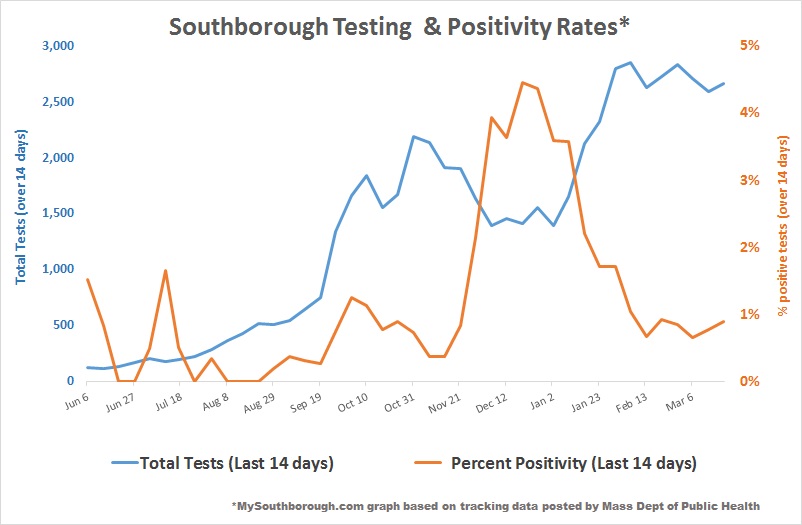 The % of tests confirmed positive for that period was higher this week (0.90%) You can see details of the positivity rate trend in my graph right.
The Town’s Average Daily Incidence Rate per 100,000 was 17.7 (also higher).
The state also designated all of our immediate neighbors as still yellow. (Those towns are Framingham, Ashland, Northborough, Hopkinton, Marlborough and Westborough.)
 I circled further out by one town to look at their stats. At this time, all of our secondary neighbors are also designated yellow except for four lower risk communities (Berlin, Boylston, Sherborn, and Sudbury).
(Note: The Town hasn’t updated its stats since I reported them on Tuesday.)
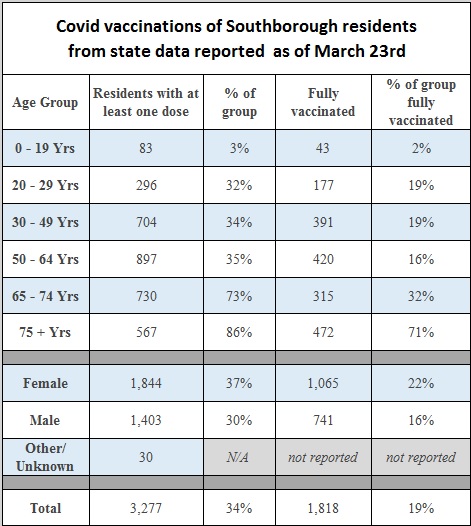
Vaccination Reporting
Last week, I shared the Town’s news on the vaccinations of residents by age group. Yesterday, I discovered that the Mass Public Health is reporting a lot more demographic data for each Town in a weekly report.
Worth noting, 78% of Southborough residents ages 65 and older are at least partially vaccinated. 48% of the seniors are fully vaccinated.
Expanding the group to ages 50+, 52% of those residents have received at least one dose of a vaccine. Overall, 436 additional residents received their first (or only needed) dose last week. Almost 300 more residents became fully vaccinated.
Below are some of the key figures as of March 23rd by age group and by gender.
The state is also sharing more details for each group, plus data categorized by race and ethnicity. I summarized it all in a pdf you can view here.
Updated (3/26/21 8:28 am): I added better clarification to the “Other” section under the race/ethnicity chart in the pdf, (and made some formatting changes to the post).
Updated (3/26/21 8:39 am): I added more data on the number of residents vaccinated since last week’s report.