
![]()
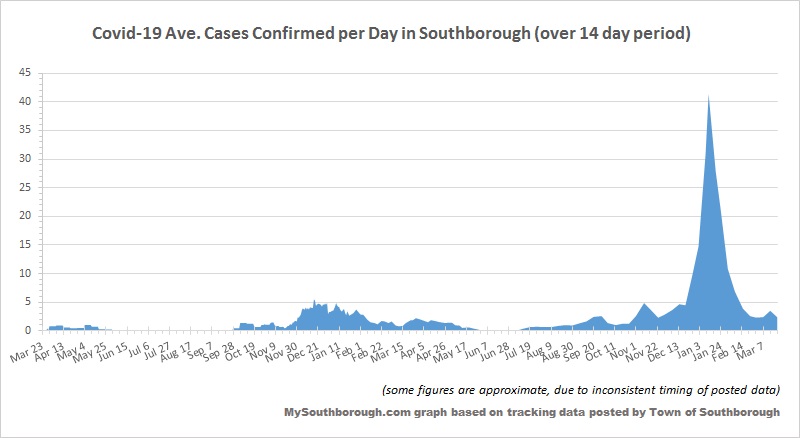
Above: Stats for Southborough cases for the week ending Monday showed the lowest count in five months.
It’s been over a week since I shared Covid stats in the town and schools. So, it’s time for an update.
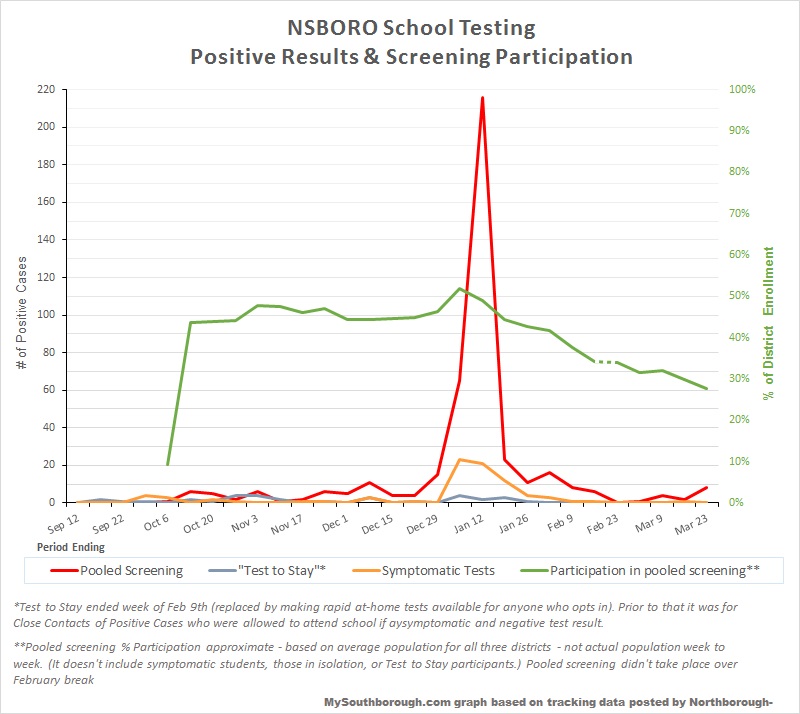
The Northborough-Southborough School’s Dashboard through Wednesday showed another low case count (8 for the week). But there was a significant uptick in yesterday’s cases (13 in one day). I’m hoping that’s an outlier based on the timing of when students are encouraged to take rapid at-home tests. Meanwhile, participation in weekly pooled tests has dropped. (Scroll down for more details.)
For our town, Southborough’s latest numbers were posted on Monday, March 21st. At that time, infection stats were the lowest since before Halloween. The one week count for new/probable cases was 6 residents, the same number as listed active/in isolation.
The two week daily average was back down to 2.4 cases after an uptick the prior week.
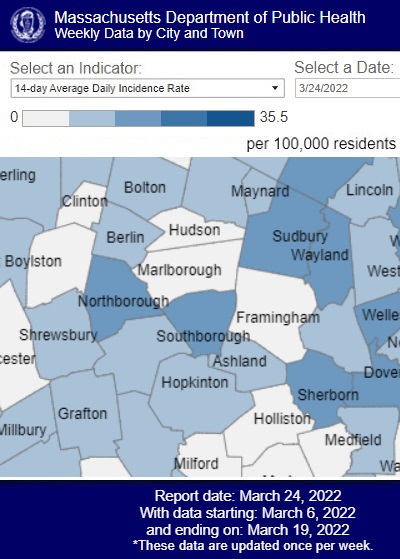
 That decrease is also reflected in the latest state report issued last night (based on results of tests taken through Saturday the 19th.) The Average Daily Incidence Rate per 100,000 people was 19.9. The state’s positivity rate for tests did show a slight uptick for the second week. (It’s now at 2.51%)
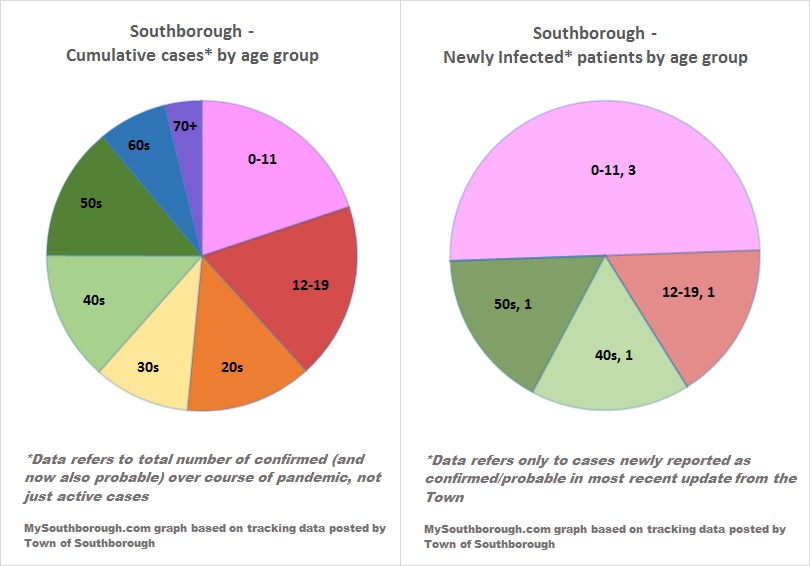
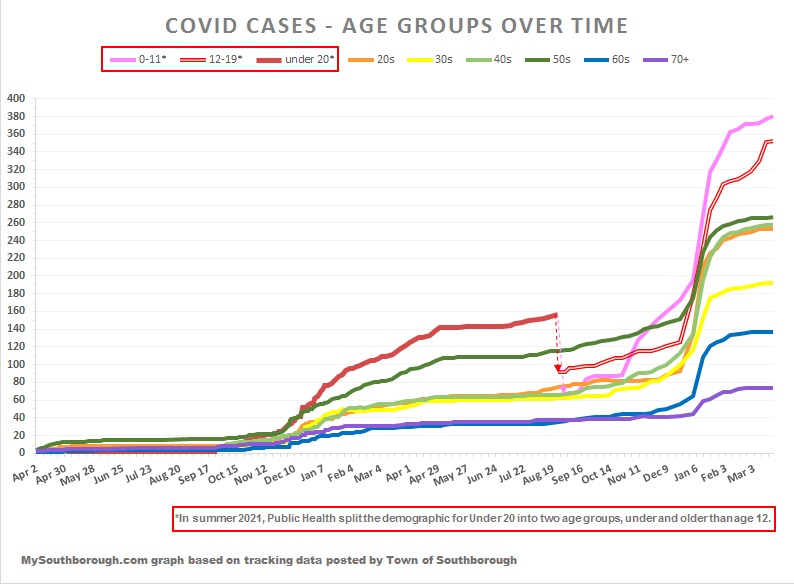
Below are more of my updated graphs include demographic info from the Town’s report, plus a look at the state’s map for the region.
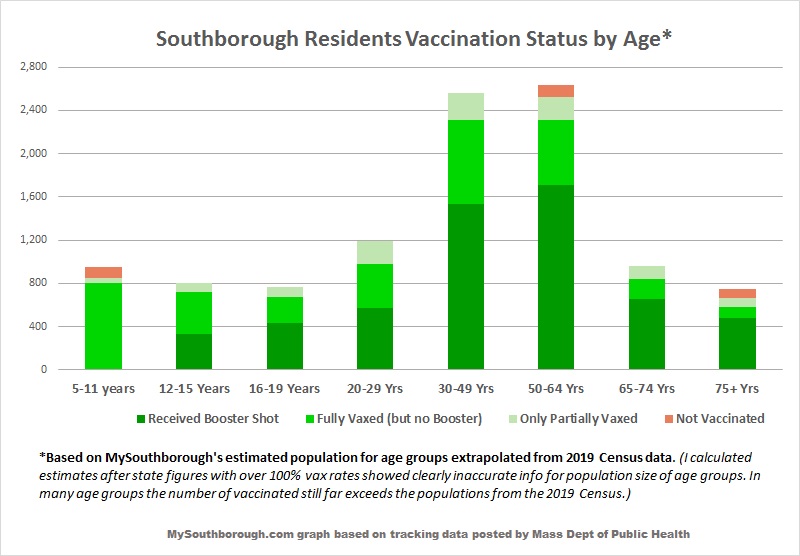
There hasn’t been much movement in vaccination rates since I last shared them. About 95% of eligible residents were fully vaccinated as of March 22nd. But only 65% of those eligible to receive booster shots have gotten them. (To find clinics/locations to receive a Covid Vaccine/Booster, click here.) My updated chart and graphs are below:
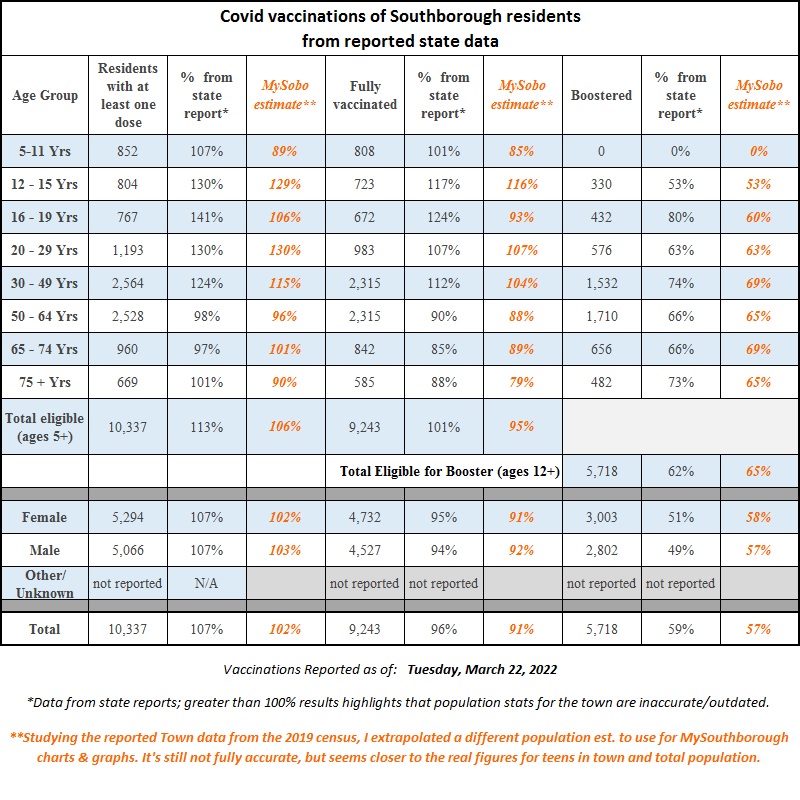
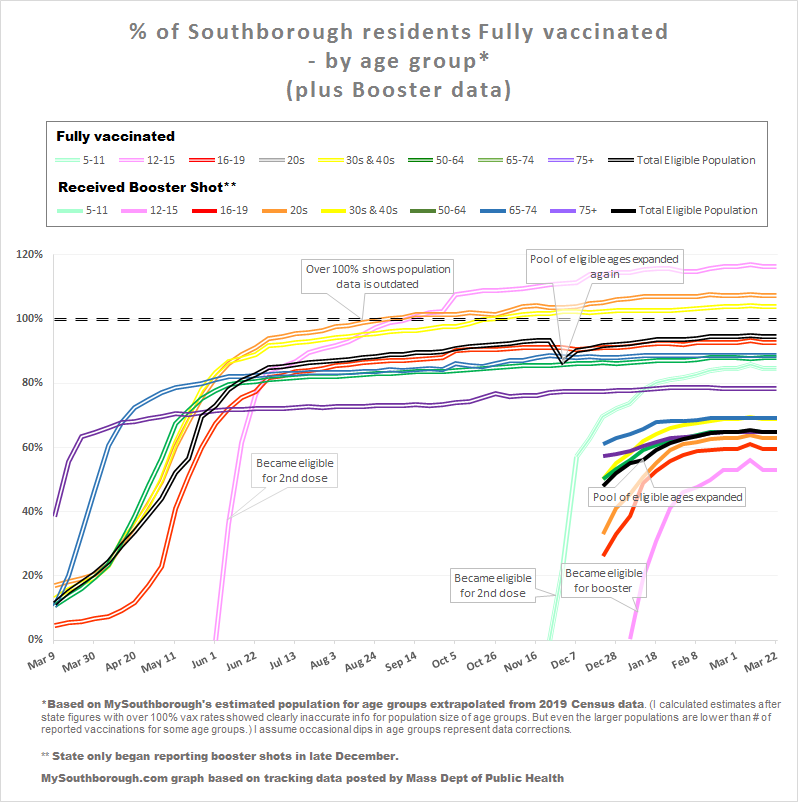
You can also find more detail (and race/ethnicity stats) here.
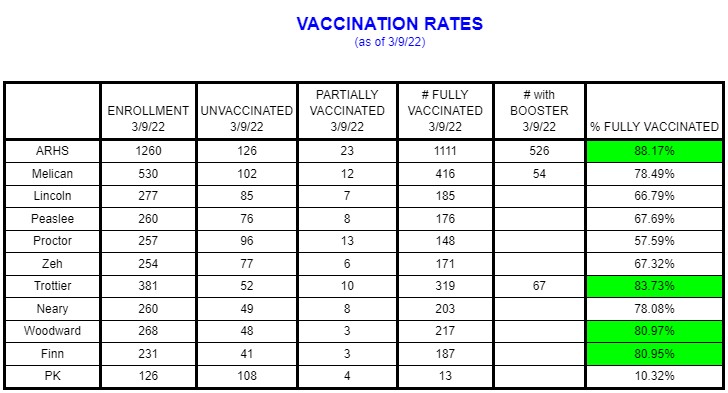
NSBORO Schools also posted the vaccination stats for students, as of March 9th. You can see that below, along with my latest graphs tracking cases and testing in the schools.
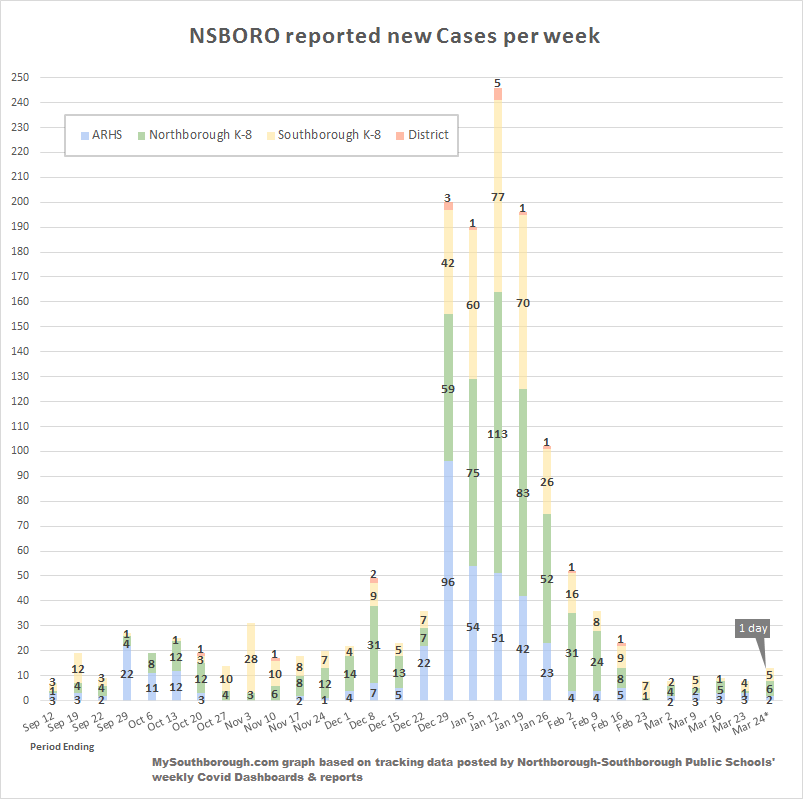
The Dashboard and Daily Count showed 21 cases over 8 days, with 9 from Southborough K-8 and 5 from Algonquin.
The testing data shows that while the pooled program screened 8 positive cases last week, participation has dropped from 52% (an early January peak) to 28%.