
![]() This afternoon, the Town posted its updated Covid data. There has been a continued uptick in new/probable cases over the last four weeks.
This afternoon, the Town posted its updated Covid data. There has been a continued uptick in new/probable cases over the last four weeks.
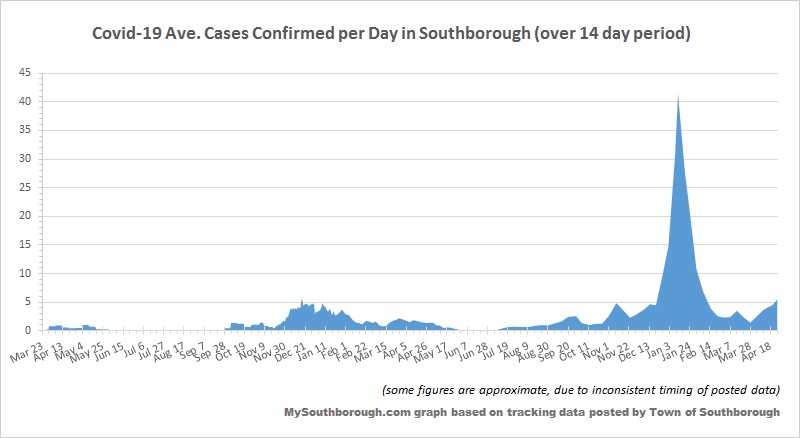
The average number of cases per day is higher than it has been since late January, but still far below the winter’s peak. 33 cases were reported in five days, 75 in two weeks.
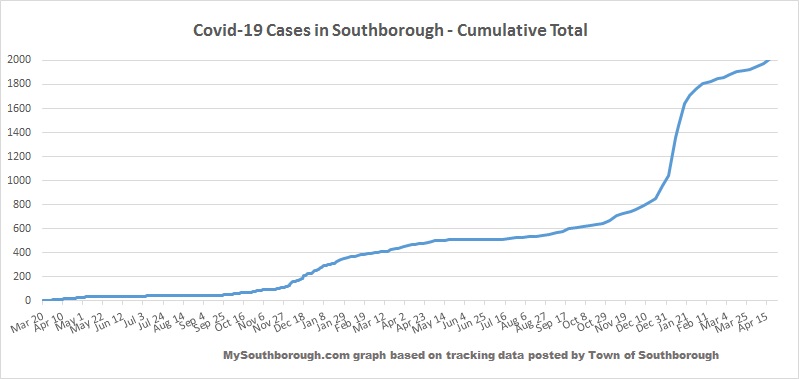
That brings the cumulative total to 2053 cases with 32 labeled active.
Below are more of my updated graphs based on the latest data:
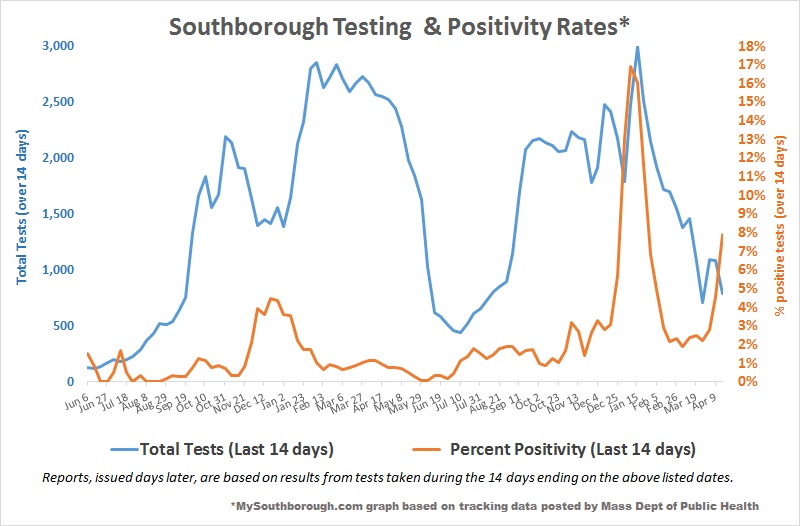
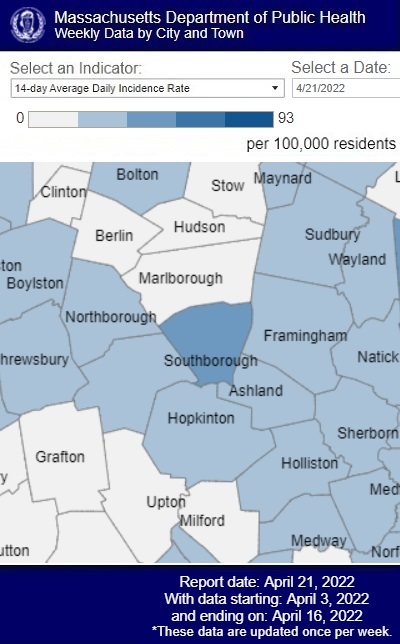
Thursday’s state report based on overlapping data, indicated 57 cases in two weeks. The Average Daily Incidence Rate per 100,000 was 42.1 (an increase for the third straight week). The % of tests confirmed positive was 7.89% (that’s also continually increased over three weeks).* See below my tracking of the testing & positivity rates and a regional map of the most recent incidence rate.
The most recent Northborough-Southborough Public Schools District Dashboard covers through Wednesday, April 20th (overlapping spring break). In one week, 31 cases were reported, 15 from Southborough K-8 and 7 from ARHS.

Daily Counts showed an additional 22 additional cases were reported through yesterday (Sunday the 24th) – 9 from Southborough and 5 from Algonquin. Since last week was spring break, no pooled screening was conducted.
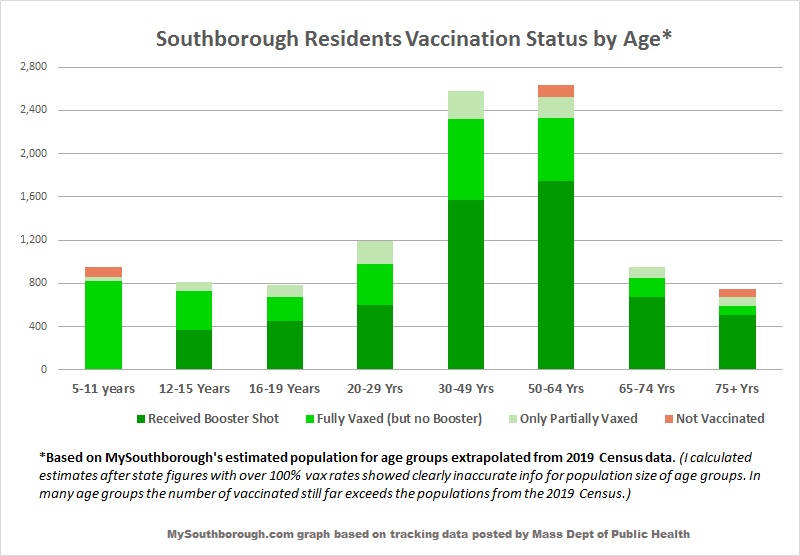
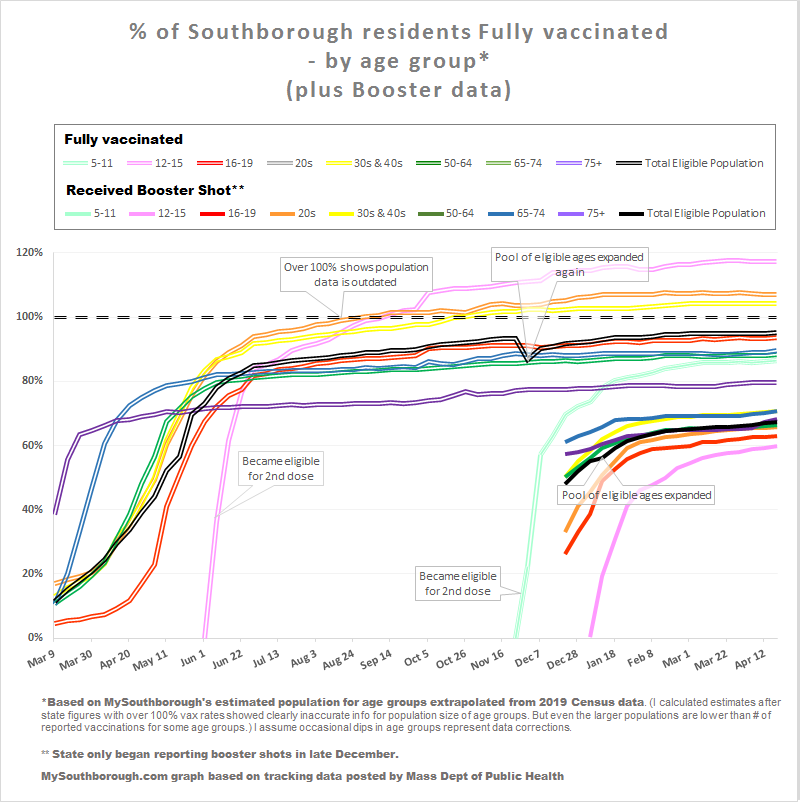
The latest report on how many in the community are taking advantage of vaccines and boosters hasn’t changed much recently. As of April 19th about 95% of eligible Southborough residents were “fully vaccinated”. About 67% of residents ages 12+ had boosters.**
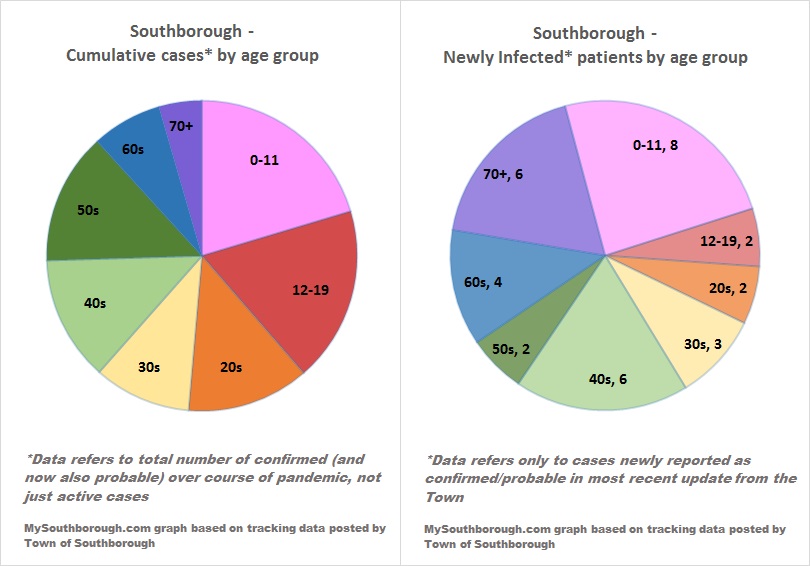
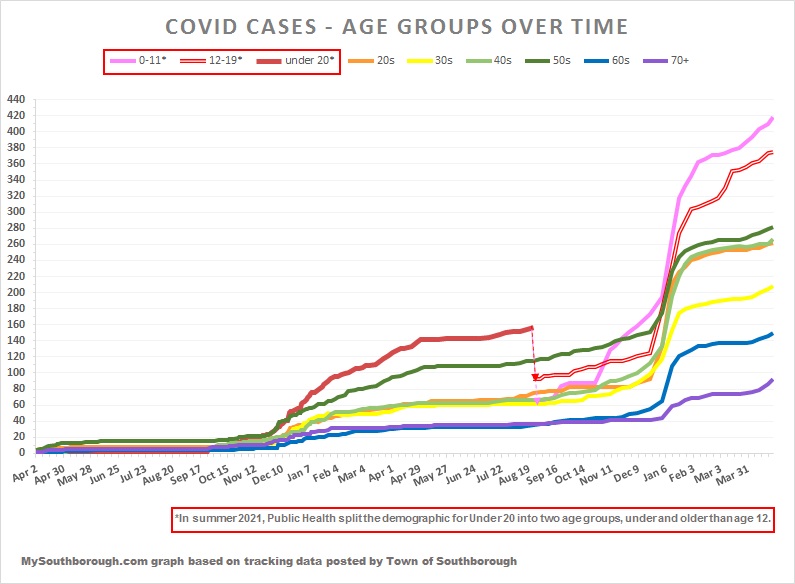
More highlights by age group and gender, and the data for NSBORO schools, are in charts and graphs below:
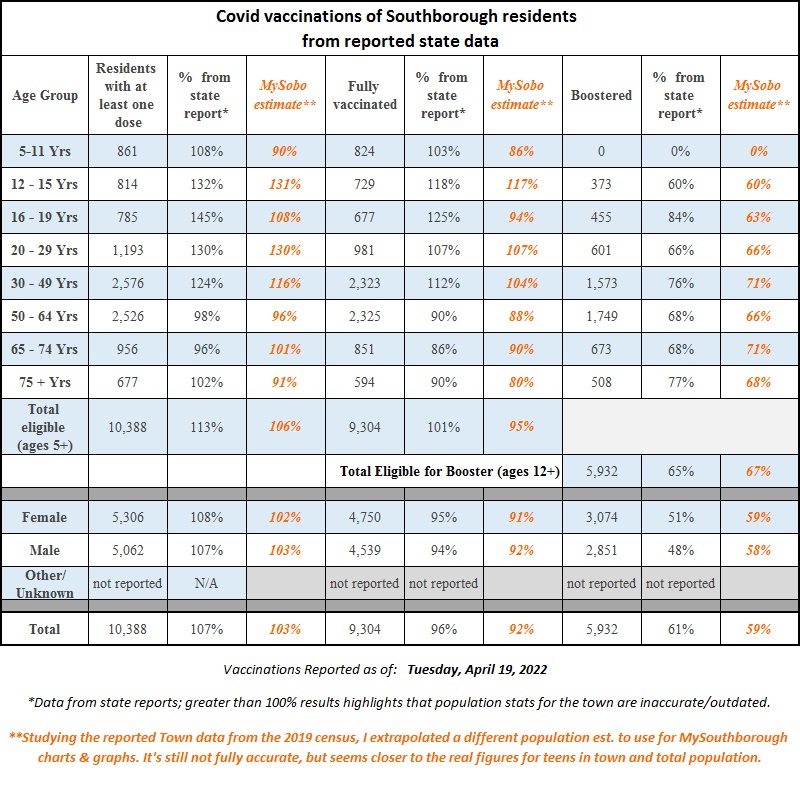

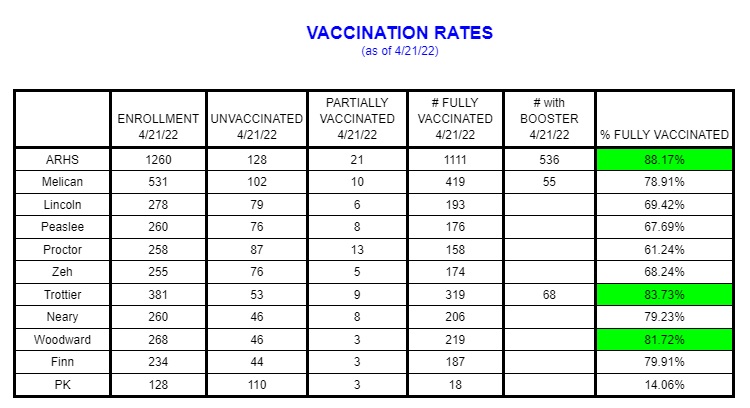
(For more details, plus race/ethnicity rates, click here.)
*The state Public Health reports on positivity rates and cases are issued on Thursday evenings based on results from tests taken during the 14 day period ending the prior Saturday.
**For vaccination stats, I calculated used census data since the state’s population data was clearly outdated. Yet even that clearly undercounts our population.