
![]()
Above: The number of residents confirmed to have Covid-19 and in isolation peaked last week. (click graph to enlarge)
[Updated (12/1/20 12:11 pm): This morning the Town posted 10 new cases. I’ll be posting updated stats and graphs on the blog’s Covid-19 page.]
The Town’s latest Covid-19 figures were updated on Saturday. 24 cases were confirmed within 2 weeks, 15 within a week. It’s the biggest spike Southborough has seen during the course of the pandemic. There are currently 16 active confirmed cases in town.
 The Town’s cumulative total over the course of the pandemic is now 120. (For details, see graphs above and right.)
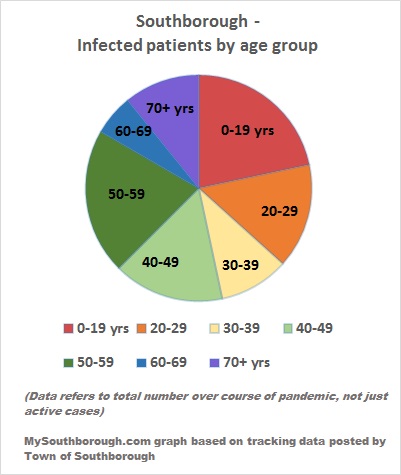
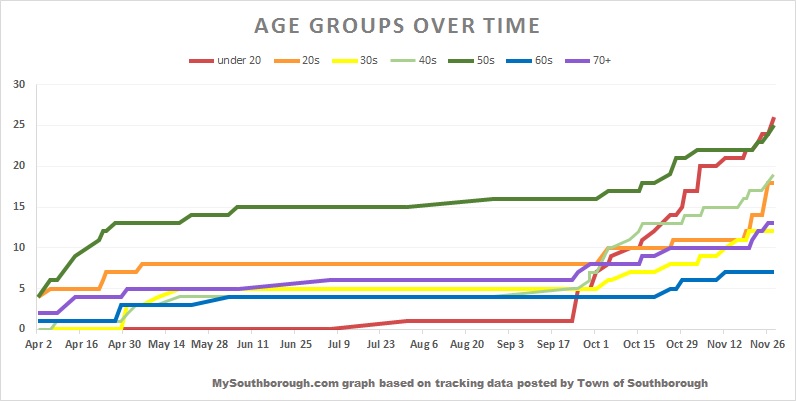
The majority of recent cases were under the age of 30. That means the spike may be due to college kids testing before/after returning home. Below are my updated graphs tracking the ages the Town has reported for confirmed cases.
The most recent weekly report from the state (issued on Thanksgiving) raised Southborough’s risk level to yellow/elevated. That is based off of 16 confirmed cases from tests taken in the 14 days ending Saturday, November 21st.*
Under the old criteria, Southborough would have been designated red. Under the revised criteria based on the size of our town, it takes 26+ cases in 14 days to trigger that. Northborough remained yellow, the status it has been at for weeks.
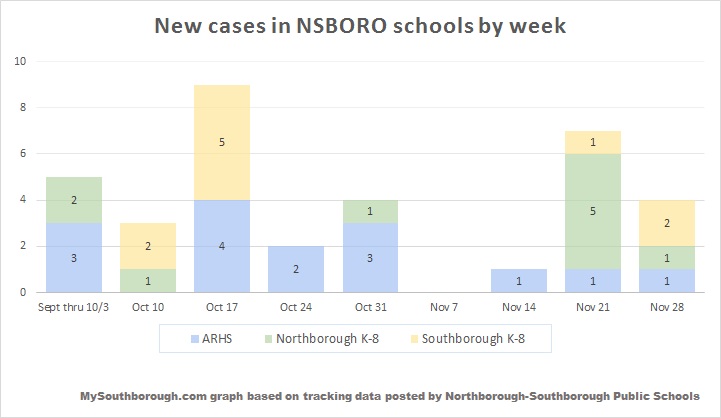 Last night, the Northborough-Southborough schools posted their weekly Dashboard. It shows 4 currently active cases across the district, 31 over the course of the pandemic. Two of those are linked to Southborough schools and one to Algonquin. (See graph right.)
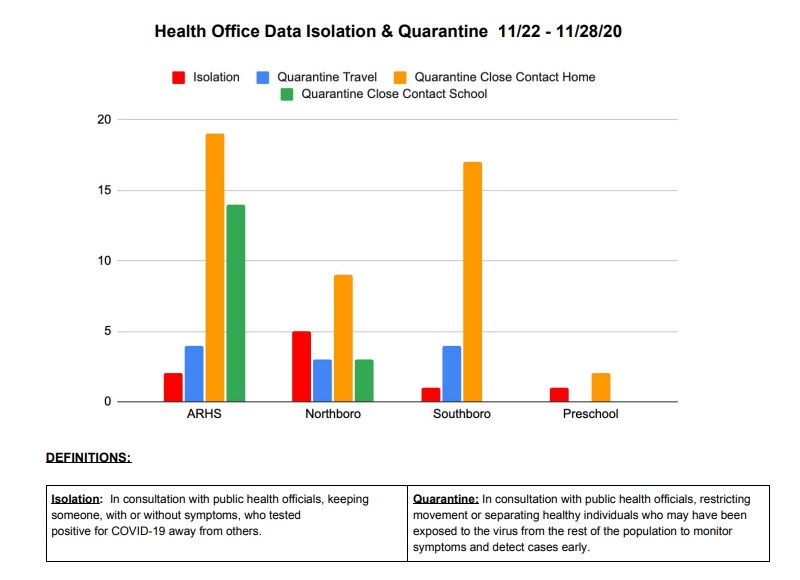
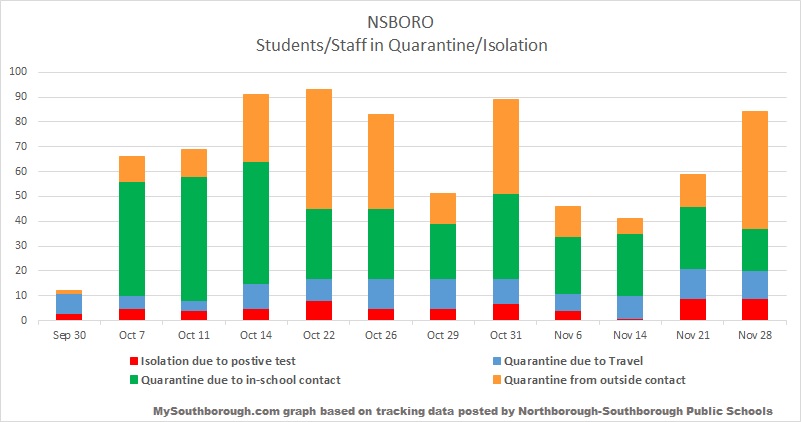
The number of students/staff kept home either in isolation or quarantine (for various reasons) was back up to 84 last week. That’s higher than recent weeks but lower than peak figures in October. (Since the district has strict travel quarantine protocols, families who traveled for Thanksgiving could cause that figure to spike in the next weekly report.)
The schools’ data covering last week’s isolation and quarantines is below. It’s followed by my chart capturing data since the start of school from past reports.
*You can read about why there are sometimes big differences between the Town data I track and the state’s data in a prior post here. (The main reason is that I track the Town’s data which posts new cases as they are confirmed. The state’s data is based on the date the test was taken, not when the results come in.)

Isn’t it curious that the age groups showing the spike in cases over the last several weeks include:
– the 20 and under age group
– the 20-29 age group
These groups include all school-attending young people as well as those recently graduated.
One might be inclined to think these people are exposing themselves to others at a higher rate than other age groups and/or not taking sufficient precautions.
The last I read, the virus was said to be transmitted person-to-person.