
![]()
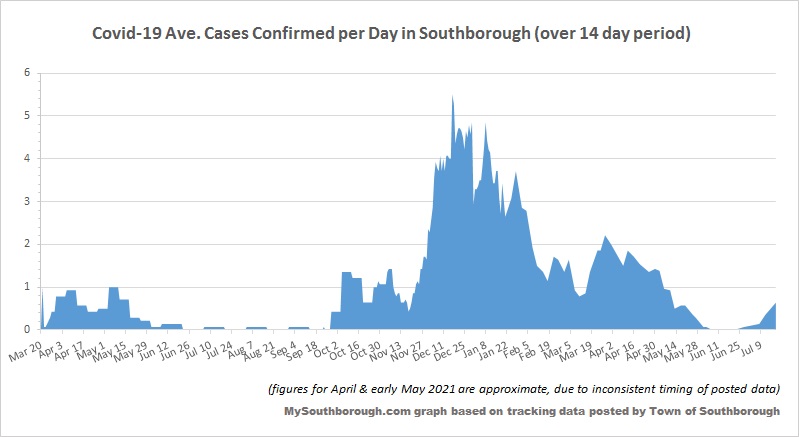
Above: While the number of cases went up in town again, it looks like they didn’t stay active for long. (click image to enlarge)
Southborough Board of Health updated its figures as of yesterday, July 19th. At that time there were 4 new cases confirmed since their last update as of July 12th, but only one was considered still active.
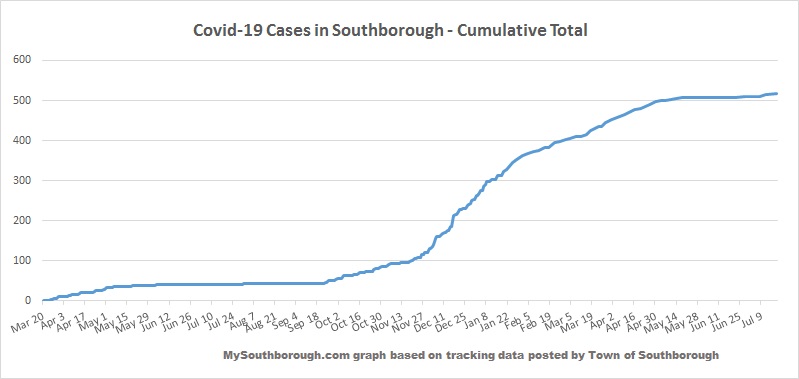
The Town’s cumulative total over the course of the pandemic is 518 cases. (For details, click on graphs above and below.)

State reporting:
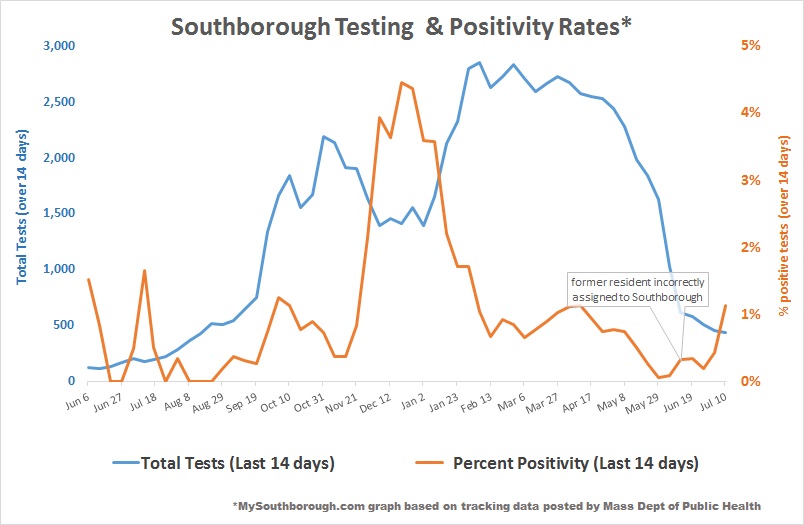
Testing & Positivity Rates – last week’s report (issued July 15th) indicated 3 cases in two weeks with the Average Daily Incidence Rate per 100,000 as 2.2 (higher than prior period) and the % of tests confirmed positive as 1.14% (also higher). (The reports are issued on Thursday evenings, based on data covering the 14 day period ending on the prior Saturday.) See my tracking of the testing & positivity rates right.
It appears that the state stopped actually classifying risk for cities and towns in its weekly reports. (Starting with the June 26th report, the state has colored the “color” field grey with no printed word. I took it to mean grey, since the field still exists. However, under the past metrics, there are cities/towns that would have been designated green/red/yellow last week.)
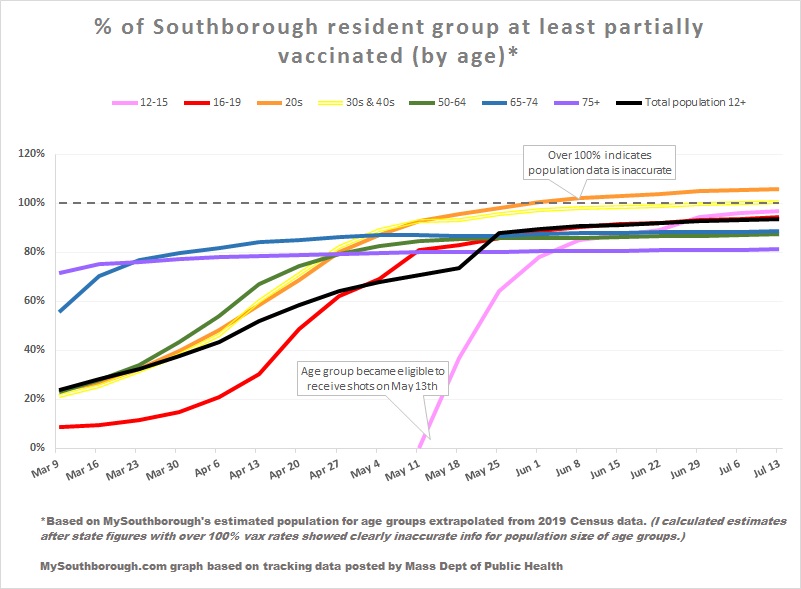
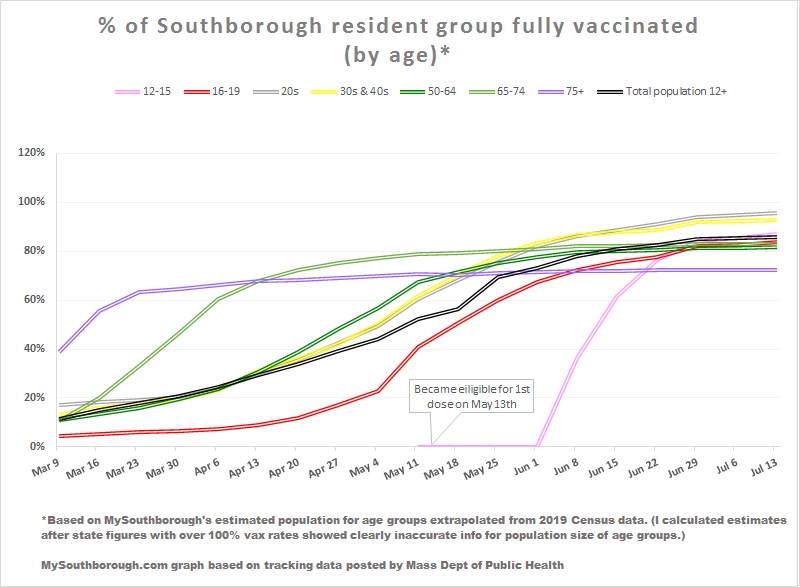
Vaccinated Residents
As of last week’s report – 8,200 Southborough residents had received shots (as of July 13th).
My data extrapolated from 2019 census reports indicates 85% of residents ages 20+ are fully vaccinated, and another 7% are partially vaxxed. Plus, 95% of teens are at least partially vaccinated and 84% fully vaccinated. (I used census data since the state’s population data was clearly outdated.)
Vaccination curves have flattened out this summer.
Since the data is based on vaccinations in state, the Board of Health is having difficulty tracking how many residents not confirmed as vaccinated are truly actually unvaccinated. (Especially senior “snowbirds”.)
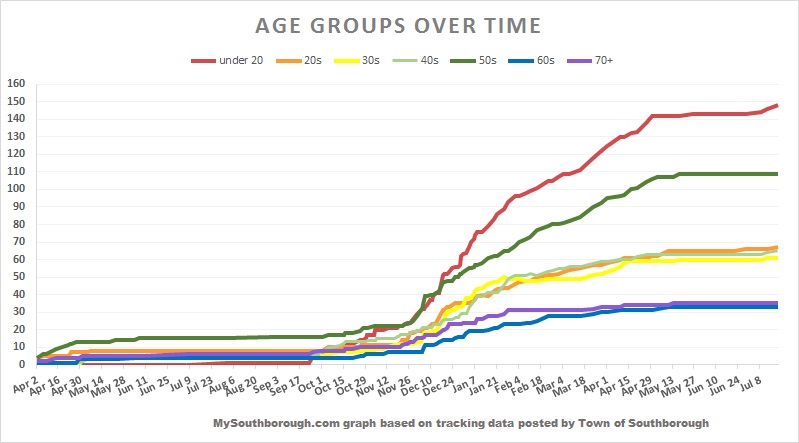
More highlights by age group and gender are in charts below:


(For more details on those groups, plus race/ethnicity, click here.)
Vaccine Clinics
To find a clinic/location to receive a Covid Vaccine (including follow-up doses) click here. (If you’re wondering about the eligibility timing and criteria to enter the Vaxmillions drawing, click here. The deadline to be entered for the first drawings is July 22.)